

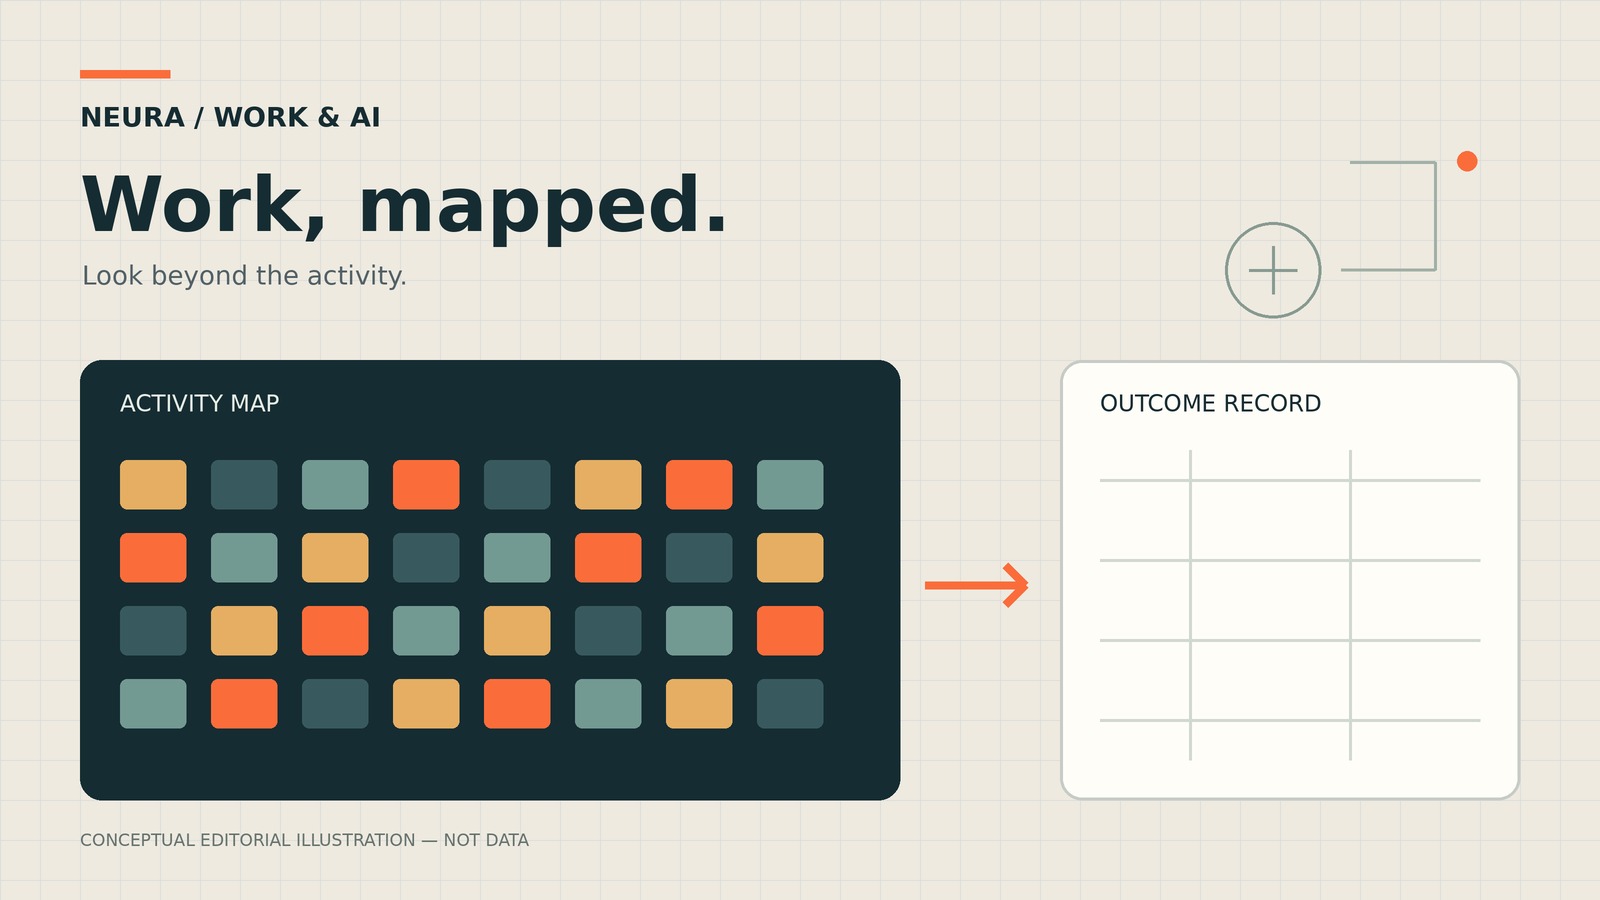
A worker might ask an AI assistant to explain a spreadsheet, revise the explanation and check a formula. Those exchanges could represent a useful shortcut, a difficult learning session or an unsuccessful attempt. The messages alone would not settle which.
That distinction matters as AI companies publish more detailed accounts of workplace use. These releases can help researchers see where people turn for assistance. Readers still need to ask what was counted, who was included and whether the record follows a task through to its result.
What the new release measures
On October 26, OpenAI released a Signals update connecting work-related ChatGPT messages to 165 work activities across nearly 100 countries. The quarterly series covers the first quarter of 2025 through the third quarter of 2026. Its O*NET activity framework lets researchers compare patterns using categories shared across occupations.
The scope is consumer use. Enterprise messages and Codex are excluded. The version 3.0 methodology describes a monthly sample of one million consumer messages from accounts declaring an age of at least 18, excluding deleted accounts and people who opted out of training use.
The work-activity table reports each category’s share of work-related messages within a country and quarter. Categories come from automated classification rather than respondents identifying their own activities. The methodology also warns that smaller subsets have greater statistical variance. Privacy protections include de-identification and noise added to published aggregates.
NEURA analysis: a missing finish line
Consider a hypothetical increase in messages about preparing instructional materials. That could reflect more teachers finding useful assistance. It could also reflect existing users asking more follow-up questions, or a changing mixture of people using the service. The activity label cannot distinguish these explanations by itself.
Nor does a message count reveal whether a lesson was adopted, whether it improved learning or whether preparation took less time. A task that needs repeated corrections could produce a busy conversation and a disappointing result. A successful one-shot request could leave a smaller trace.
These are measurement possibilities, not findings about the released data. They explain why a usage pattern should lead to a question that another dataset can test. Moving directly from that pattern to a claim about jobs removed would skip the evidence about staffing, demand and organizational decisions.
What company-level evidence adds
Anthropic’s October 16 research examines a different unit: its own workplace. The report combines internal employment and output records with employee surveys and 17 interviews. It reports a declining share of junior technical hires while technical hiring continued growing in absolute terms.
The researchers also compare employees adopting coding agents with colleagues who had not yet adopted them. They explicitly acknowledge that adoption was not random. Employees preparing for larger projects might choose the tools, complicating attribution. The report further cautions that more code does not necessarily establish better code or business impact.
This is complementary first-party evidence, not an independent test of OpenAI’s dataset. One rapidly expanding AI company cannot stand in for the wider labor market. Its value here is showing the additional records needed to investigate how use, output and employment relate.
NEURA analysis: build a fuller scorecard
For employers, a practical evaluation would pair adoption measures with accepted output, correction time and changes in responsibilities. Define a completed task before the pilot begins. Record the time spent reviewing and repairing work, including work returned by another team. Ask whether the service improved without shifting an uncounted burden elsewhere.
For workers, the useful conversation is similarly concrete: which duties changed, what new skills are needed and how will the organization support that transition? A message-volume chart cannot answer those questions on their behalf.
The new work map gives researchers more places to look. Its strongest contribution will come from connecting those observations to evidence about what happened next.